
What UK Property Investors Are Really Doing Right Now: Demand-Attention-vs-Commitment
Public discussion about UK property demand has become increasingly polarised. On one side, headlines point to caution, regulation, and investor fatigue. On the other, transaction statistics show continued activity and a market that is still functioning, albeit unevenly. Both narratives are based on data, yet they appear to contradict each other.
They do not.
The confusion comes from mixing two very different signals: attention and commitment.
Attention shows up early. It appears in search behaviour, commentary, and questions. It rises when uncertainty increases and when investors reassess risk, structure, and exposure. Commitment shows up much later. It appears in transactions, applications, and completed deals, after finance, pricing, and confidence have cleared real-world constraints.
This article brings those two signals together.
It compares anonymised search behaviour observed over January and February with official UK transaction and market commentary data. The goal is not to predict prices, rank markets, or declare turning points. It is to understand how investors are behaving when conditions are tighter, decisions are slower, and scrutiny is higher.
What emerges is a more nuanced picture than most headlines allow.
Investors are cautious, but they are not absent. Attention is concentrated where risk and structure are unclear. Commitment appears only when deals are concrete and specific. Generic language about “best areas” or “best strategies” attracts curiosity, but rarely action.
Seen together, search behaviour and transaction data do not conflict. They describe different stages of the same decision cycle. Attention tells us where uncertainty lives. Commitment tells us where capital is still willing to move.
Understanding the difference is essential for reading UK property demand clearly, without being misled by noise on one side or lagging data on the other.
Executive Summary: The Four Behaviour Rules Emerging From the Data
This analysis compares real search behaviour observed in January and February with official UK transaction and market data. When viewed together, four clear behavioural rules emerge.
Investors Are Cautious, Not Absent
Search behaviour shows heightened scrutiny around risk, costs, and structure, not disengagement. At the same time, national transaction data confirms that activity continues, albeit more selectively. Investors are still present, but fewer deals meet their requirements.
Attention Clusters Around Risk, Sourcing and Structure
Search interest concentrates where uncertainty is highest. Queries relating to deal sourcing, property sourcing agreement, analysis, contracts, costs, and downside risk attract materially more attention than opportunity-led language. This suggests investors are pressure-testing decisions before acting, not chasing momentum.
Commitment Shows Up Only in Address-Level Behaviour
Generic searches generate attention. Specific property searches generate action. When investors engage with concrete, address-level opportunities, behaviour changes immediately. Click-through rates improve, positioning tightens, and intent becomes visible. Commitment follows specificity.
“Best Areas” and “Best Strategy” Languages Signal Curiousity, Not Action
Broad, aspirational queries attract impressions but rarely result in engagement. They reflect interest without conviction. In contrast, searches tied to process, structure, and individual deals show far stronger behavioural signals.
The Data We’re Comparing (And Why It Matters)
Understanding investor behaviour requires separating early-stage signals from late-stage confirmation. This analysis deliberately compares two very different types of data, because each captures a different moment in the same decision cycle.
The Micro Dataset: Real Search Behaviour (January – February)
The first dataset is anonymised search behaviour observed over a two-month period. It reflects what users searched for, how often those searches were shown results, and when they chose to engage.
This data captures attention under uncertainty.
To make the behaviour readable, queries were grouped by intent rather than treated individually. When categorised this way, clear patterns emerge.
Across the observed queries:
-
Approximately 54% of total impressions relate to deal sourcing, intermediaries, and access mechanics
Examples include searches around deal sourcing, sourcing contracts and intermediaries, sourcing fees, and off-market access. -
Around 12–13% of impressions relate to risk, cost, and downside pressure
This includes searches about selling rental property, losing money on buy-to-let, voids, tenant turnover, and landlord expenses. -
Roughly 12% of impressions are address-level or property-specific searches
These are materially different in behaviour, showing higher engagement and stronger intent. -
About 10% of impressions fall under generic opportunity language
Phrases such as “best areas to invest”, “best strategy”, and similar aspirational searches appear frequently but rarely convert. -
The remaining impressions are spread thinly across niche technical topics such as lease issues, BRRR variants, and calculation tools.
This distribution matters. It shows that most attention is not focused on opportunity hunting, but on process, structure, and survivability.
What the Search Data Is Good At Showing
Search behaviour is most reliable at revealing:
-
where uncertainty is highest
-
which questions investors ask before committing
-
how cautious or exploratory a market feels
It is not a measure of demand in isolation. It is a measure of pre-decision behaviour.
The Macro Dataset: Transactions and Market Activity
To avoid drawing conclusions from search behaviour alone, this analysis is viewed alongside official UK transaction and market commentary data.
National transaction statistics and industry research show that:
-
overall transaction volumes have stabilised rather than collapsed
-
activity continues even during periods of subdued confidence
-
completions lag sentiment by several months
This matters because it explains the apparent contradiction between noisy online caution and continued real-world activity. Search behaviour leads. Transactions confirm later.
Why These Two Datasets Belong Together
Viewed independently, each dataset can mislead.
Search data alone can exaggerate fear.
Transaction data alone can hide hesitation.
Viewed together, they explain each other.
Search behaviour shows where investors are pausing, questioning, and reassessing. Transaction data shows where capital still clears the hurdles. The gap between the two is not weakness. It is filtering.
That is why this comparison is useful. It does not attempt to forecast outcomes. It explains how demand expresses itself at different stages, and why investor behaviour today looks cautious without being absent.
Macro Reality Check: Activity Is Not Collapsing
To understand investor behaviour, it is essential to look beyond search signals and incorporate the official transaction and application datasets that reflect real economic activity in the UK property market.
This section places search behaviour alongside late-stage indicators — actual completions and application volumes — to provide context and prevent misinterpretation.
What Completions Suggest About Baseline Activity
The most recent official data on property transactions shows that UK residential sales are not collapsing. According to the UK Government’s monthly property transactions data, in December 2025, there were approximately 100,440 seasonally adjusted transactions valued at £40,000 or more.
Even on an unadjusted basis, total transactions were around 105,730. These figures represent ongoing activity and continuity in transactional flows, suggesting that although market conditions may feel pressured to participants, transactions are still occurring at scale.
This matters because search behaviour — especially attention-heavy and uncertain searches — often spikes before actual transactional changes are recorded.
Search data is a leading indicator of attention, while completions are a lagging indicator of commitment.
What Applications Suggest About Operational Volume
Complementary to completions, the UK Government’s data on HM Land Registry applications offers a higher-level workflow signal.
Data published in early 2026 shows that January applications increased to approximately 1,919,998, up from 1,607,442 in December. Applications include indemnity submissions for title registrations and reflect broader market activity rather than finalised sales.
This rise provides a clear counterweight to uncertainty narratives: operational workflows remain active, suggesting continued engagement from buyers, conveyancers, and lenders even amid tighter conditions.
Applications are not completions — but they are upstream of them, and increases in applications historically signal future transactional follow-through.
Why “Low Confidence” Can Coexist With “Robust Activity”
Property markets can, and often do, exhibit subdued confidence in sentiment data while still sustaining transactional volumes.
For example, industry data from Savills’ research highlights that although sentiment and confidence indicators have softened, total transactions for 2025 were about 1,212,240, roughly 10% higher than in 2024.
This apparent contradiction is informative:
-
Search and sentiment data often reflect uncertainty and risk reassessment, not absence of intent
-
Completion and application data reflect capital that has moved through the hurdles and actually transacted
Seen together, these datasets show that markets can feel cautious, and still function.
In other words: low confidence does not equal low activity.
Micro Signals: What Investors Are Actually Searching For
When search behaviour is grouped by intent rather than by individual keywords, a clear hierarchy emerges. This hierarchy tells us far more about investor psychology than headline volumes ever could.
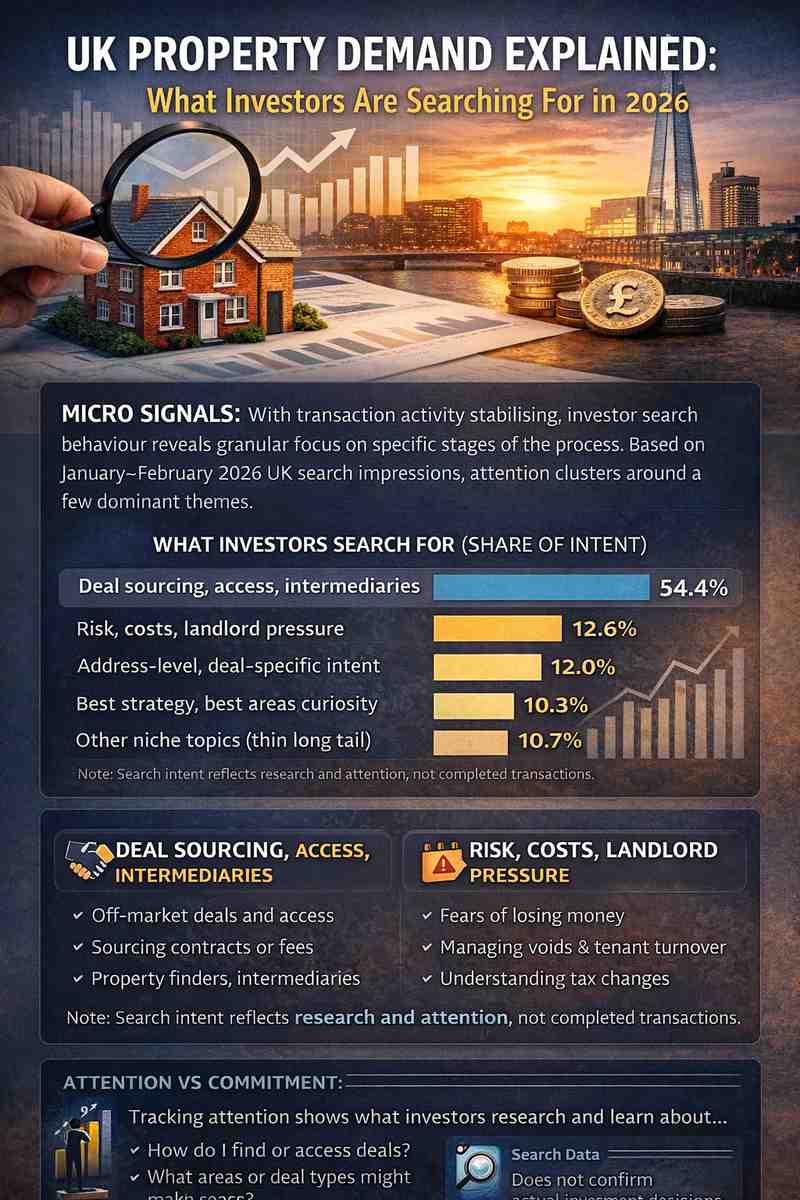
Across the observed dataset, attention is not evenly distributed. It clusters decisively around a small number of behavioural themes.
Category 1: Deal Sourcing Dominates the Attention Stack (54.4%)
The largest share of impressions, just over 54%, relates to deal sourcing, intermediaries, and access mechanics.
This includes searches around deal sourcing itself, sourcing contracts, sourcing fees, off-market access, and deal origination processes. These queries consistently outperform opportunity-led language in visibility, even when engagement remains cautious.
This is not hype-seeking behaviour. It is infrastructure-seeking behaviour.
Investors are spending more time trying to understand:
-
how deals reach the market
-
who controls access
-
what obligations and risks sit within sourcing arrangements
This suggests that participation is becoming conditional. Investors are not asking “where should I invest?” first. They are asking “how do deals actually get done, and under what terms?”
When access and process dominate attention, it signals a market where entry points matter more than narratives.
Category 2: Risk, Costs, and Landlord Pressure (12.6%)
Approximately 12.6% of impressions are concentrated around downside and survivability.
These queries relate to:
-
selling rental property
-
losing money on buy-to-let
-
void periods and tenant turnover
-
allowable expenses and landlord costs
This is not speculative fear. It is exposure management.
Investors already in the market are reassessing viability. Prospective investors are interrogating failure points before committing. In both cases, the behaviour reflects caution grounded in experience, not retreat.
Notably, this category attracts attention without urgency. The questions persist, suggesting ongoing reassessment rather than reactive exits.
Category 3: Address-Level Intent Behaves Differently (12.0%)
Roughly 12.0% of impressions are tied to specific addresses or individual properties.
What distinguishes this category is not volume, but behaviour.
When searches become concrete and location-specific:
-
engagement increases
-
click-through rates improve
-
average positions tighten
This is where commitment begins to surface.
Address-level searches indicate that the investor has moved beyond abstract thinking. The deal exists. The variables are visible. The question is no longer “should I invest?” but that shift marks the move into deal-level analysis.
This shift in behaviour marks the transition from attention to evaluation.
Category 4: “Best Areas” and “Best Strategy” Curiosity Does Not Convert (10.3%)
Around 10.3% of impressions fall into broad, aspirational language such as:
-
best areas to invest
-
property investment strategy
-
best cities or regions
These queries are highly visible, but they rarely result in engagement.
This pattern is consistent: impressions without clicks, curiosity without follow-through.
Such language travels well in content and commentary because it is easy to consume. But the data suggests it sits at the outer edge of intent. It reflects interest, not readiness.
In contrast, queries tied to structure, risk, and specificity consistently attract deeper engagement.
What This Distribution Tells Us
Taken together, these categories describe a market that is:
-
process-driven
-
risk-aware
-
selectively engaged
Attention is not scattered. It is focused where decisions feel hardest.
Investors are not absent. They are narrowing their criteria, interrogating structure, and reserving commitment for moments when opportunities become tangible.
This is not what disengagement looks like.
This is what filtering looks like.
Attention vs Commitment (The Mismatch Most People Miss)
One of the most persistent errors in property commentary is treating attention as evidence of intent. Search behaviour, sentiment surveys, and online discussion are often read as direct indicators of demand. In reality, they capture a much earlier and noisier stage of the decision process.

This is where many narratives go wrong.
Why Uncertainty Creates Attention
Periods of uncertainty reliably produce higher visibility, not lower interest.
When assumptions are challenged, investors seek information. They search more, read more, and compare more. That behaviour shows up clearly in search data as rising impressions and broad curiosity, particularly around risk, structure, and viability.
This dynamic is reflected in wider market commentary. Research from Savills describes a market characterised by subdued confidence, yet continued activity. That combination is not contradictory. It is typical of transitional markets.
Confidence measures sentiment. Activity measures outcomes.
When confidence softens, attention increases because investors are reassessing. That reassessment phase is visible, searchable, and often misinterpreted as disengagement. In reality, it is the period when criteria tighten and weaker assumptions are exposed.
Attention rises because decisions become harder, not because investors disappear.
Why Commitment Only Shows Up When the Deal Is Specific
Commitment behaves very differently from attention.
In the search data, this distinction is clear. Generic queries generate visibility but limited engagement. In contrast, searches tied to specific properties or addresses show materially different behaviour.
When a deal becomes concrete:
-
click-through rates improve
-
average search positions tighten
-
engagement becomes decisive
This shift occurs because specificity collapses uncertainty. Once an address, price point, and structure are visible, the investor can move from abstract evaluation to deal-level analysis.
This is why address-level searches punch above their weight in behavioural terms. They represent moments where commitment becomes possible, even if execution still depends on finance, pricing, and risk tolerance.
The broader lesson is simple but often missed.
Attention reflects where questions exist.
Commitment appears only when answers can be tested against something real.
Treating attention as demand exaggerates fear in uncertain periods. Ignoring commitment signals underestimates how quietly capital continues to move.
Understanding the gap between the two is essential for reading UK property demand accurately, especially when noise is loud and execution is selective.
UK property investors are not stepping away from the market. They are narrowing their criteria. Attention has shifted toward risk and structure, while commitment now appears only when opportunities are concrete and specific.
What This Data Tells Us About Investor Demand
When search behaviour and transaction context are read together, a consistent picture emerges. Investor demand has not vanished. It has become conditional, selective, and unevenly distributed.
This is not a market driven by optimism. It is a market driven by thresholds.
Demand Is Being Filtered, Not Switched Off
The strongest signal in the search data is not opportunity-seeking, but process-seeking.
With approximately 54.4% of impressions concentrated around deal sourcing, access, and structure, investors are signalling that how a deal is sourced and controlled matters more than where it is located. That behaviour is consistent with a market where fewer deals qualify and more scrutiny is applied before engagement.
At the same time, only around 10.3% of impressions relate to generic “best areas” or “best strategy” language, and those queries show negligible engagement. This suggests that broad market narratives attract attention, but not conviction.
Demand has not disappeared. It has narrowed.
Risk Awareness Is Absorbing a Meaningful Share of Attention
Around 12.6% of impressions focus on risk, costs, and downside pressure. This includes queries related to selling rental property, losing money on buy-to-let, void periods, tenant turnover, and allowable expenses.
This proportion is significant.
It indicates that a non-trivial share of investor attention is devoted to survivability rather than expansion. Investors are stress-testing existing exposure and interrogating where returns break before deciding whether to deploy new capital.
Markets where demand is collapsing do not exhibit this behaviour. Markets that are filtering do.
Commitment Is Concentrated, Not Broad-Based
Although address-level searches account for only around 12.0% of impressions, they behave disproportionately differently. Engagement is stronger, positions are tighter, and behaviour is more decisive.
This asymmetry matters.
It shows that when opportunities are specific, priced, and visible, commitment still appears. Demand is not evenly spread across the market. It is concentrating around deals that clear higher hurdles.
In practice, this means fewer transactions overall, but greater competition for stock that meets revised criteria.
What This Says About Demand in Practical Terms
Taken together, the data suggests that current UK property demand is:
-
selective, not absent
-
risk-aware, not speculative
-
process-driven, not narrative-led
-
concentrated, not evenly distributed
Attention is high where uncertainty exists. Commitment emerges only where uncertainty is reduced.
This explains why online sentiment can feel pessimistic while real-world activity continues. It also explains why generic commentary struggles to capture what investors are actually doing.
Demand today is not loud. It is conditional.
Understanding that distinction is the difference between misreading caution as weakness and recognising it as discipline.
What This Data Cannot Tell Us (And Why That Matters)
As useful as search behaviour and transaction data are when viewed together, there are hard limits to what they can explain. Recognising those limits is essential. Without them, data-led analysis quickly turns into false certainty.
This section is not a disclaimer. It is part of the signal.
Search Data Does Not Capture Capital Strength
Search behaviour does not tell us who has cash, who has lending in place, or who is constrained by leverage.
Two investors can search for the same topic for very different reasons. One may be exploring an acquisition with deployable capital. Another may be assessing whether an existing portfolio remains viable. The data records both as attention, even though their capacity to act is fundamentally different.
This is why attention can rise while transaction volumes remain stable or fall. Capital strength sits outside the dataset.
Private and Network-Driven Activity Is Invisible
A meaningful share of serious investor activity never appears in public search data.
Repeat buyers, cash investors, and relationship-driven operators source deals through agents, private introductions, off-market conversations, and existing networks. Their behaviour surfaces late, if at all, through completed transactions.
The absence of these investors from search data does not mean absence from the market. It means their decision-making happens elsewhere.
Transaction Data Lags Behaviour by Design
Transaction and application data confirm commitment, but they do so with a delay.
By the time a transaction completes, the decision was often made months earlier. Pricing, finance, and risk appetite may already have shifted again. This lag explains why transaction data can look resilient even when sentiment and attention feel fragile.
Search behaviour leads. Transactions follow.
Neither should be read in isolation.
Deal Quality Is Not Visible in Aggregates
Perhaps most importantly, no dataset here tells us whether individual deals are good or bad.
Search data cannot show pricing discipline, refurbishment risk, lease structure, or exit viability. Transaction data records that a deal completed, not whether it will perform well over time.
This is why demand appearing in the data should never be confused with opportunity. Demand describes behaviour. Opportunity exists only at the deal level.
Why These Limits Strengthen the Analysis
Understanding what the data cannot tell us prevents false conclusions.
It stops us from:
-
equating attention with intent
-
mistaking transaction stability for opportunity
-
assuming uniform behaviour across investor types
Instead, it forces a more accurate reading: investor behaviour is fragmented, conditional, and uneven. Some capital is cautious. others, is active. Some is entirely invisible.
That complexity is not a weakness in the data. It is a reminder that property markets do not move as a single crowd.
Closing: How to Read Demand Without Being Misled
Reading UK property demand accurately requires resisting the temptation to treat any single dataset as definitive.
Search behaviour, sentiment, and online discussion are loud because uncertainty is loud. They surface questions, doubt, and reassessment early in the decision cycle. Transaction and application data are quieter. They confirm commitment only after pricing, finance, and risk have cleared real-world hurdles.
The mistake is not using either signal. The mistake is confusing one for the other.
This analysis shows that investor attention and investor commitment are moving on different timelines. Attention has shifted toward structure, access, and downside risk. Commitment has narrowed toward specific, concrete opportunities that can withstand greater scrutiny. Neither trend suggests disappearance. Both suggest discipline.
The data also explains why generic narratives struggle to describe what is actually happening. Broad claims about “best areas” or “market turning points” attract curiosity, but they rarely align with how capital is currently behaving. Demand is no longer evenly distributed or easily summarised. It is selective, localised, and conditional.
For investors, the implication is not to follow sentiment, but to understand where in the cycle each signal sits. Search behaviour tells you where uncertainty lives. Transaction data tells you where uncertainty has already been resolved. The gap between the two is where filtering occurs.
For journalists and analysts, the lesson is similar. Markets can feel cautious and still function. Confidence can soften without activity collapsing. Quiet demand is not the same as weak demand.
UK property demand today is harder to see because it is less noisy. It has moved away from broad narratives and toward specific decisions. That makes it easier to misread, but also easier to understand for those willing to look at behaviour rather than headlines.
Demand has not gone away.
It has become more deliberate.

Koye Beckley is a UK property investor and founder of UncommonDeal, with practical experience in buy-to-let, property auctions, refurbishment projects and investment deal analysis. Through UncommonDeal, he publishes property market research, property deal sourcing and compliance guidance, investment guides and data-driven analysis to help investors evaluate buy-to-let, BRRR, flip and auction opportunities.